
InfoSec Write-ups – Medium–
TLDR; How I’ve found four XSS vulnerabilities in Grafana rather than keep scratching the surface while hunting in a private BBP and got rewarded for three criticals(!)
* But you will have to read it to figure out why 😎
Not too long ago, I was hunting in my favorite Bug-Bounty program but couldn’t find anything new or suspicious in its narrow scope, so instead of stopping there, I decided to pursue their dependencies.
The program is using Grafana for some of its core functionalities, so I thought to myself, why not go after Grafana?

#1 Stored XSS in the table visualization (CVE-2020–12245)
After a few minutes, I have found a stored XSS in the table visualization.
I also found another one before that, but it ended up as a duplicate since it was already a known issue — https://github.com/grafana/grafana/pull/23254. ¯\_(ツ)_/¯
Impact
By exploiting this vulnerability, an attacker could have executed any JavaScript code on the victim’s browser only by them viewing a dashboard with the malicious visualization.

References
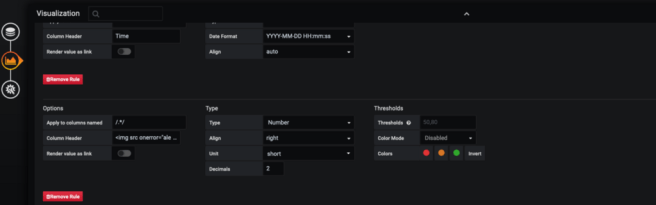
#2 Stored XSS in Pie-chart panel (CVE-2020–13429)
Pie-chart is an official Grafana plugin that comes with its default installation.
I discovered that the “Values Header” field was not validating nor sanitizing the user input and therefore was vulnerable to XSS injection.
I was able to inject a simple XSS payload, e.g. <img src onerror="confirm(document.cookie)">.
Impact
By exploiting this vulnerability, an attacker could have executed any JavaScript code on the victim’s browser only by them viewing a dashboard with the malicious visualization.
References
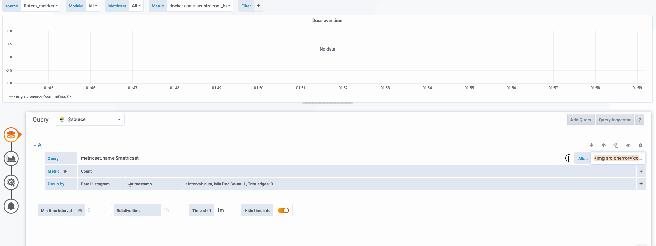
#3 Stored XSS in the graph visualization (Pending CVE)
The “alias” input field in the “Query” tab was not sanitizing nor validating the user input when using ElasticSearch as its data source, which allowed me to inject a simple XSS payload to that field (e.g. <img src onerror="alert(document.cookie)">).
The payload gets triggered once the victim opens the visualization tab.
Impact
By exploiting this vulnerability, an attacker could have executed any JavaScript code on the victim’s browser by manipulating them to open the “query” tab of a malicious visualization.
References
#4 Stored XSS in the OpenTSDB data source (CVE-2020–13430)
I have found this vulnerability via manual code review, and it is much harder to be exploited due to the exploitation’s prerequisites (described below).

Prerequisites
1. The attacker must be able to push a new tag value to the OpenTSDB data source, e.g.
curl -X POST http://localhost:4242/api/put -d '{"metric":"rotem.cpu.xss","timestamp":1346846400,"value":11,"tags":{"host":"web","dc":"lga<img src onerror=confirm()>"}}'
2. The OpenTSDB data source must allow special characters for our exploit to work:
tsd.core.tag.allow_specialchars = !@#$%^&*()_+{}|: <>?~`-=[]\;',./°
Impact
By exploiting this vulnerability, an attacker that meets the above prerequisites could have executed any JavaScript code on the victim’s browser by manipulating them to perform the following actions:
- Go to an existing or a new dashboard and add a new panel
- In the query’s data source select their OpenTSDB data source
- Add a new tag by clicking on the + sign
- Click on the value field and the XSS payload from our OpenTSDB tag value will trigger
References
Real-life exploitation
You might be asking yourself how I reported these vulnerabilities to the private BBP, and what were the severities.
I reported all the above (except for the OpenTSDB, which was irrelevant for this program), and got rewarded for 3 X Criticals.

Yep… I shit you not.
Initially, the triagers claimed that it was a “self-XSS” since (allegedly) I can only affect my own organization’s users, but that was completely a false assumption.
I explained to them that Grafana has the ability to share dashboards with other users, so that means that if I am sharing my malicious Grafana dashboard with another user which is logged in to their account — I will be able to steal their cookies and hijack their accounts.
Okay… But critical?
Then I did the next thing — Since they have a support chat in the site, I requested their permission to “request support” for my malicious dashboard and hack their support engineers, and they agreed.

On the first attempt, their support engineer entered my malicious dashboard, but for some reason, I haven’t received their session cookie. On the 2nd try, I got it all. I was now able to log in as an admin into their production account, manage their admins, view sensitive logs (including user tokens), and this was ofc enough to be considered as critical.
That was one of my best decisions to hunt in Grafana. My short journey there was rewarding and fun (I enjoyed that so much that I have even contributed two of the patches 😂).
I hope to deepen my research in Grafana and find some more exotic bugs there in the future, but didn’t have the time to do it since then.
If you enjoyed reading it, clap. If you want more, follow me on Twitter (2RS3C) 😀
Stop scratching the surface, and hack the dependencies was originally published in InfoSec Write-ups on Medium, where people are continuing the conversation by highlighting and responding to this story.
